The $50 Bet That Killed The Install Disc
One pricing decision in 1999 replaced the purchase order with a subscription. No install, just a login. That packaging choice, not the technology, built a $465B market and the growth funnel every SaaS company still runs today.
Read the slides as text
Slide 1
LIVE
•
SOFTWARE DELIVERY INDEX
•
TRACKING INSTALL TO CLOUD
•
1980 TO 2026
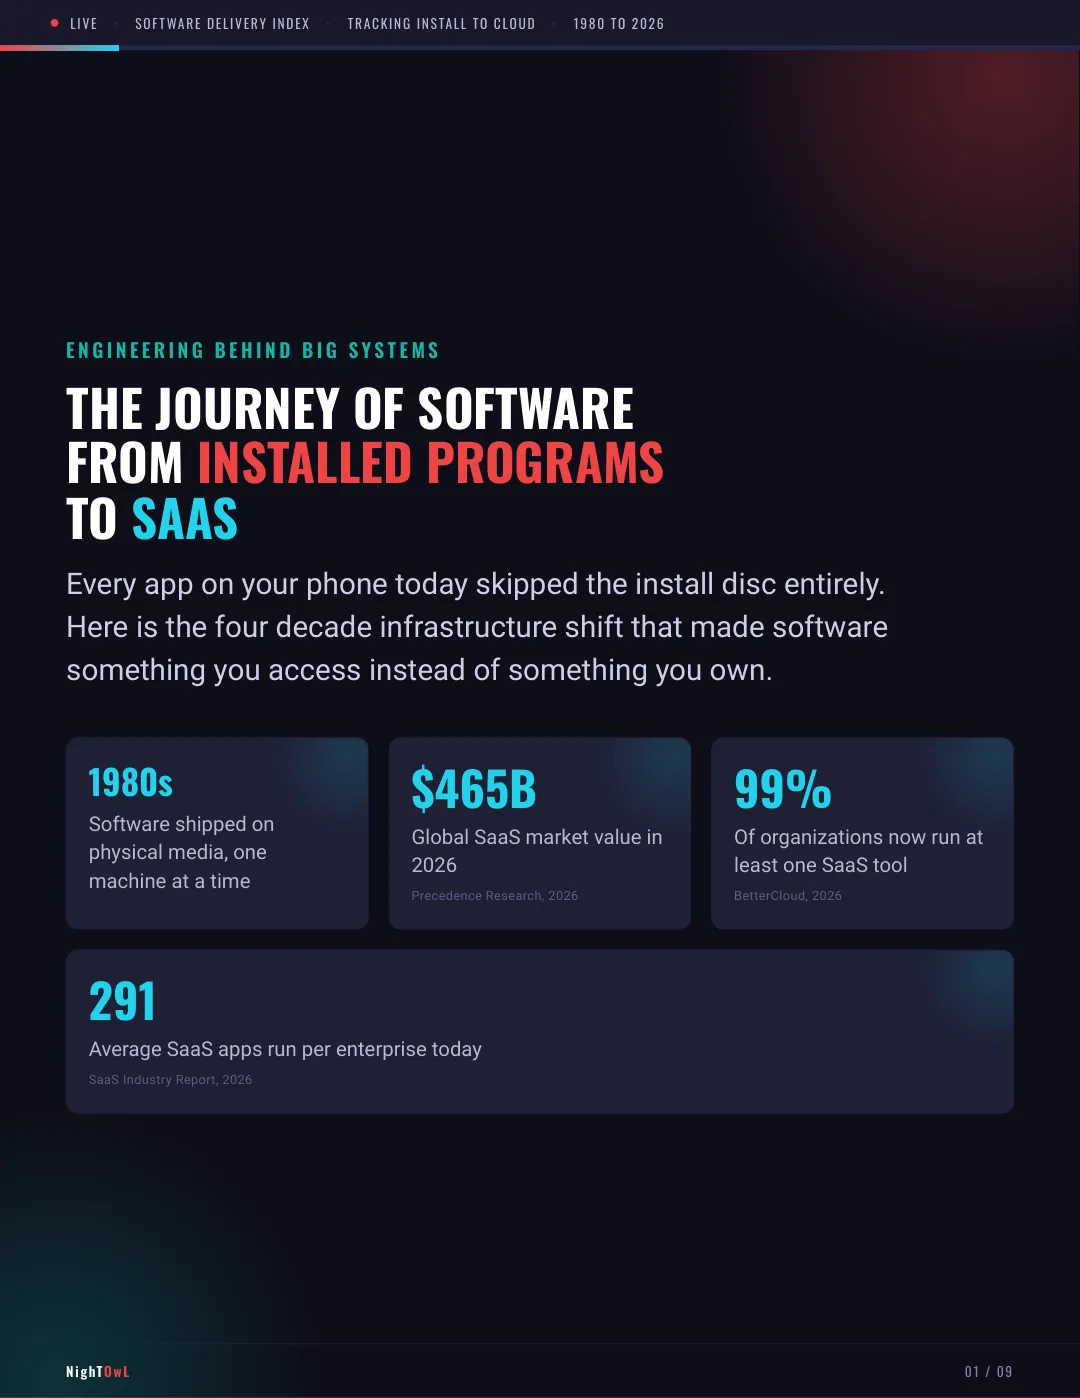
E N G I N E E R I N G B E H I N D B I G S Y S T E M S
THE JOURNEY OF SOFTWARE
FROM INSTALLED PROGRAMS
TO SAAS
Every app on your phone today skipped the install disc entirely.
Here is the four decade infrastructure shift that made software
something you access instead of something you own.
1980s
Software shipped on
physical media, one
machine at a time
$465B
Global SaaS market value in
2026
Precedence Research, 2026
99%
Of organizations now run at
least one SaaS tool
BetterCloud, 2026
291
Average SaaS apps run per enterprise today
SaaS Industry Report, 2026
NighTOwL
01 / 09
Slide 2
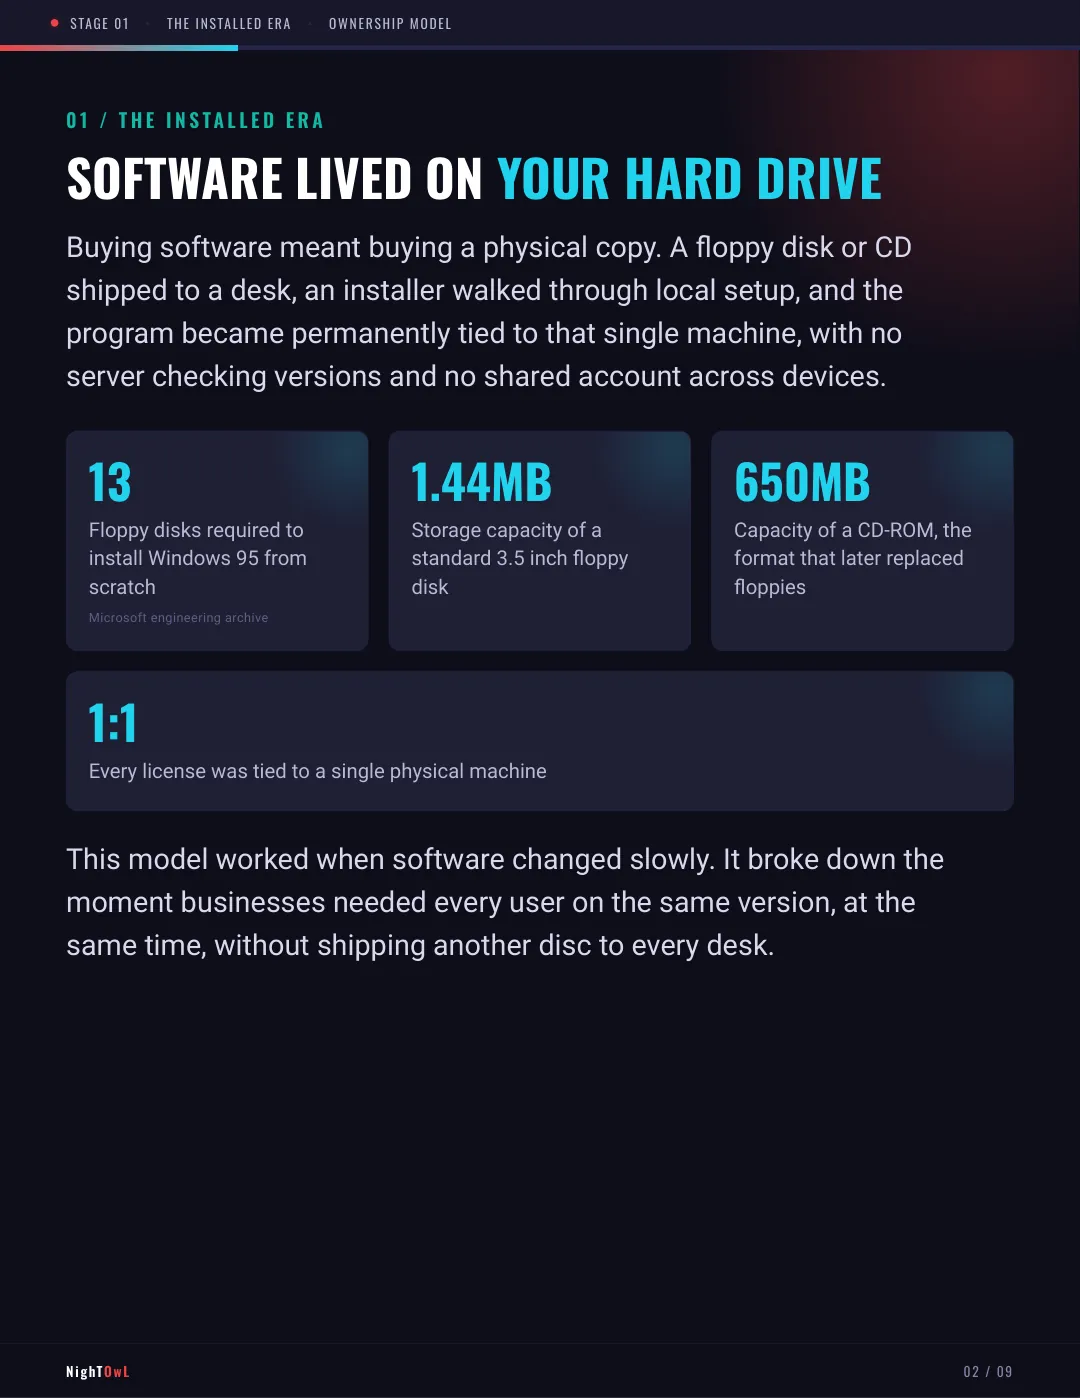
STAGE 01
•
THE INSTALLED ERA
•
OWNERSHIP MODEL
0 1 / T H E I N S TA L L E D E R A
SOFTWARE LIVED ON YOUR HARD DRIVE
Buying software meant buying a physical copy. A floppy disk or CD
shipped to a desk, an installer walked through local setup, and the
program became permanently tied to that single machine, with no
server checking versions and no shared account across devices.
This model worked when software changed slowly. It broke down the
moment businesses needed every user on the same version, at the
same time, without shipping another disc to every desk.
13
Floppy disks required to
install Windows 95 from
scratch
Microsoft engineering archive
1.44MB
Storage capacity of a
standard 3.5 inch floppy
disk
650MB
Capacity of a CD-ROM, the
format that later replaced
floppies
1:1
Every license was tied to a single physical machine
NighTOwL
02 / 09
Slide 3
STAGE 02
•
THE BOTTLENECK
•
VERSION FRAGMENTATION
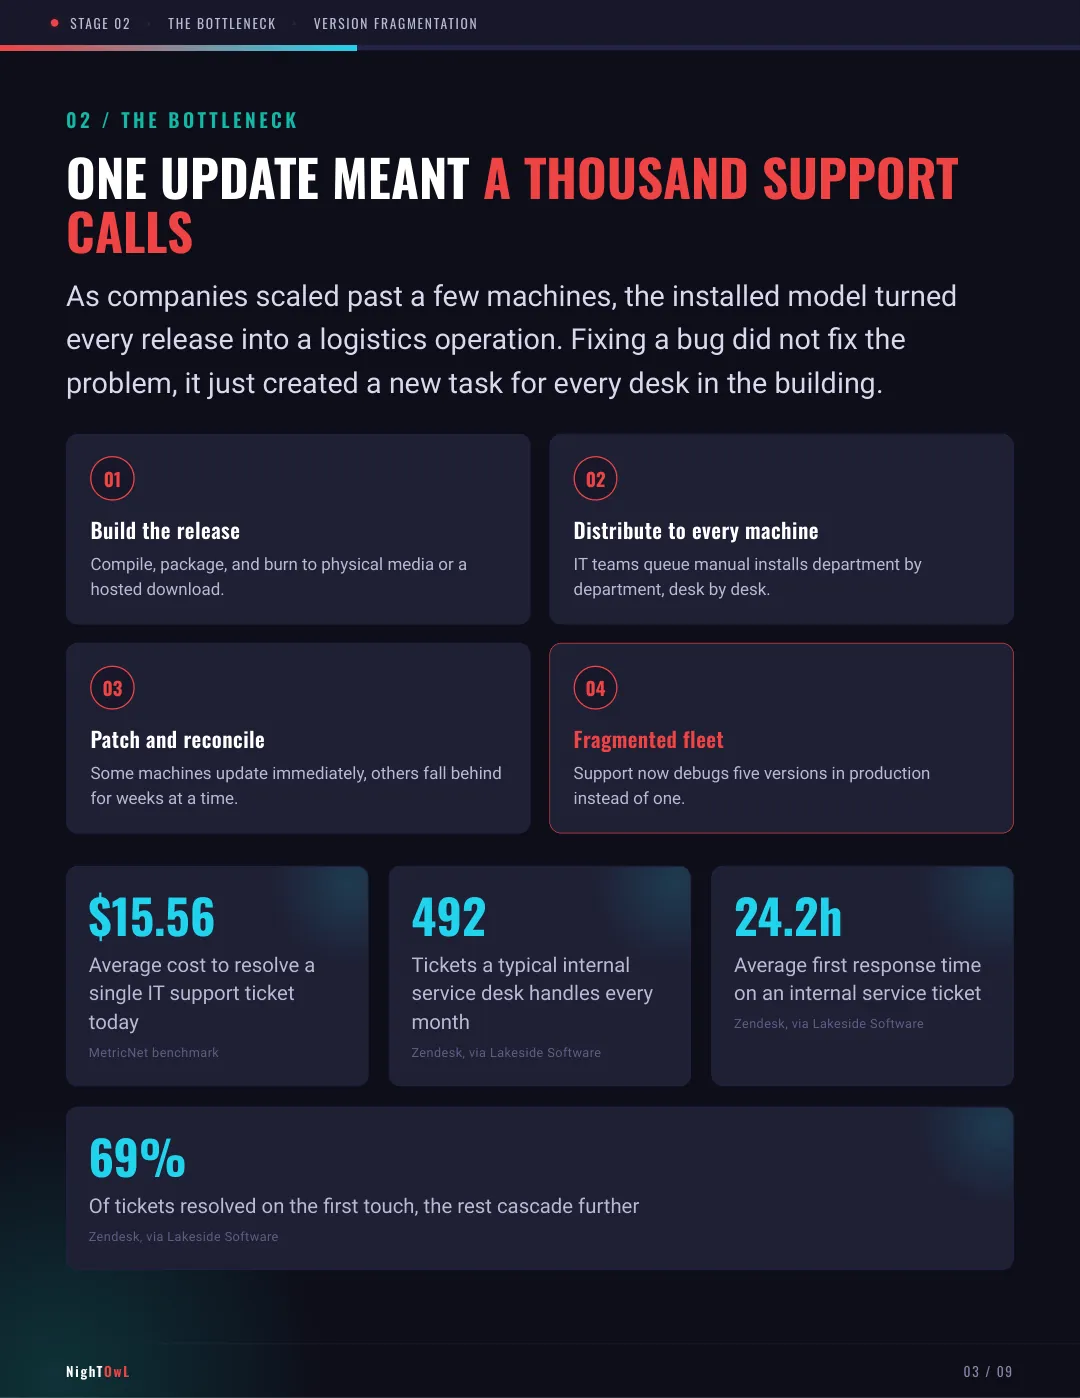
0 2 / T H E B O T T L E N E C K
ONE UPDATE MEANT A THOUSAND SUPPORT
CALLS
As companies scaled past a few machines, the installed model turned
every release into a logistics operation. Fixing a bug did not fix the
problem, it just created a new task for every desk in the building.
01
Build the release
Compile, package, and burn to physical media or a
hosted download.
02
Distribute to every machine
IT teams queue manual installs department by
department, desk by desk.
03
Patch and reconcile
Some machines update immediately, others fall behind
for weeks at a time.
04
Fragmented fleet
Support now debugs five versions in production
instead of one.
$15.56
Average cost to resolve a
single IT support ticket
today
MetricNet benchmark
492
Tickets a typical internal
service desk handles every
month
Zendesk, via Lakeside Software
24.2h
Average first response time
on an internal service ticket
Zendesk, via Lakeside Software
69%
Of tickets resolved on the first touch, the rest cascade further
Zendesk, via Lakeside Software
NighTOwL
03 / 09
Slide 4
STAGE 03
•
THE SHIFT
•
BROWSER AS PLATFORM
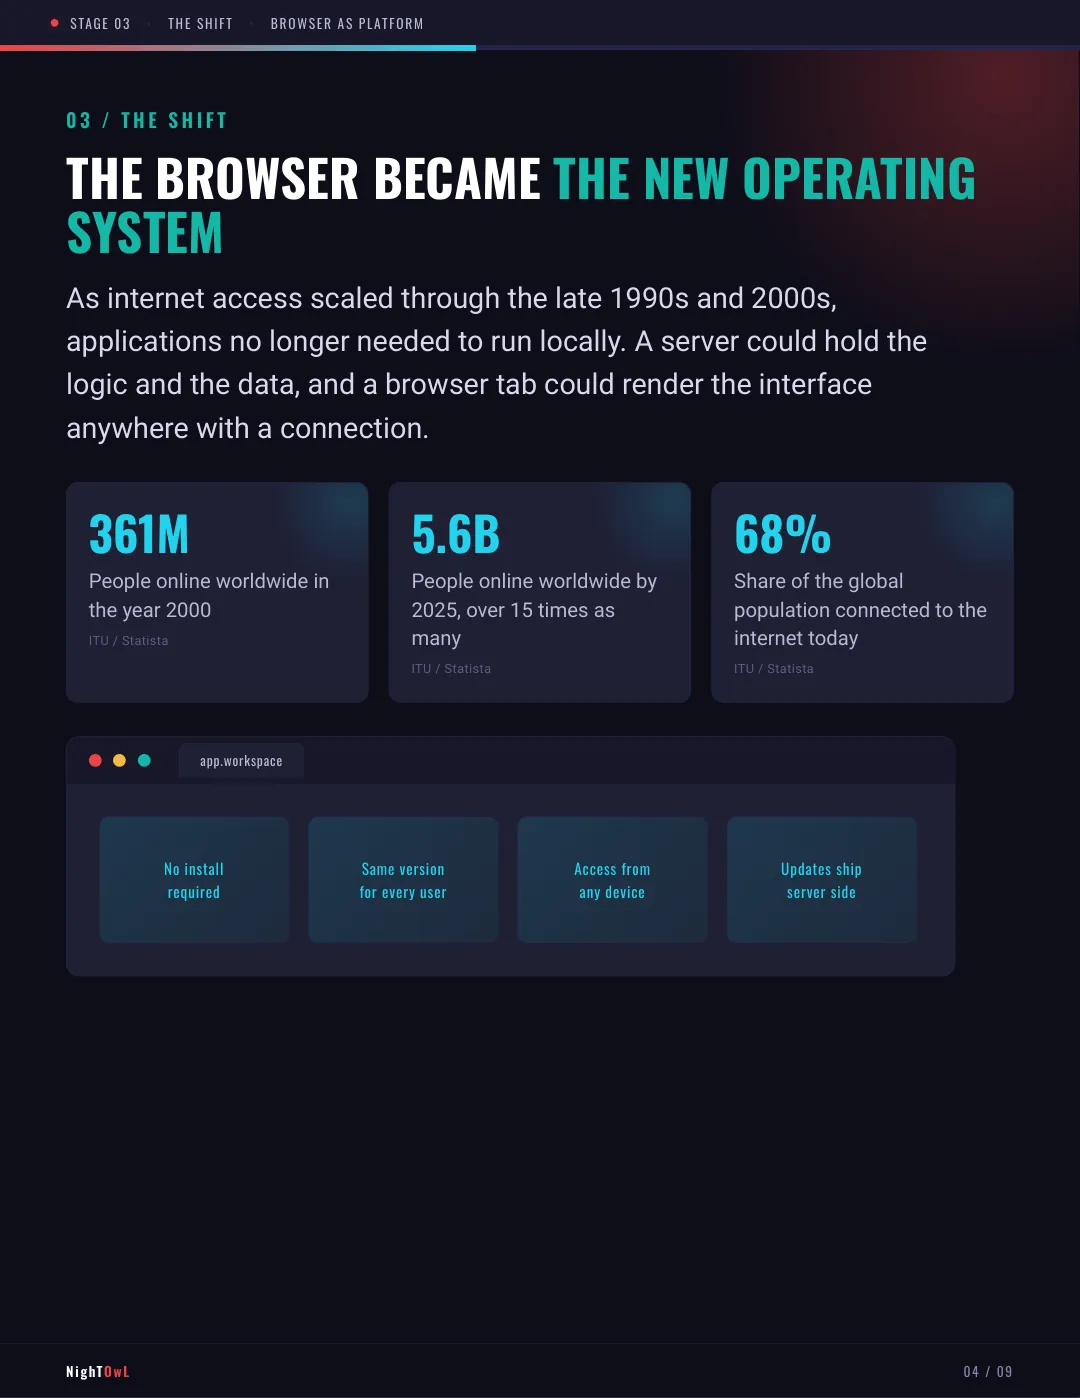
0 3 / T H E S H I F T
THE BROWSER BECAME THE NEW OPERATING
SYSTEM
As internet access scaled through the late 1990s and 2000s,
applications no longer needed to run locally. A server could hold the
logic and the data, and a browser tab could render the interface
anywhere with a connection.
app.workspace
No install
required
Same version
for every user
Access from
any device
Updates ship
server side
361M
People online worldwide in
the year 2000
ITU / Statista
5.6B
People online worldwide by
2025, over 15 times as
many
ITU / Statista
68%
Share of the global
population connected to the
internet today
ITU / Statista
NighTOwL
04 / 09
Slide 5
STAGE 04
•
THE INFLECTION
•
SUBSCRIPTION MODEL
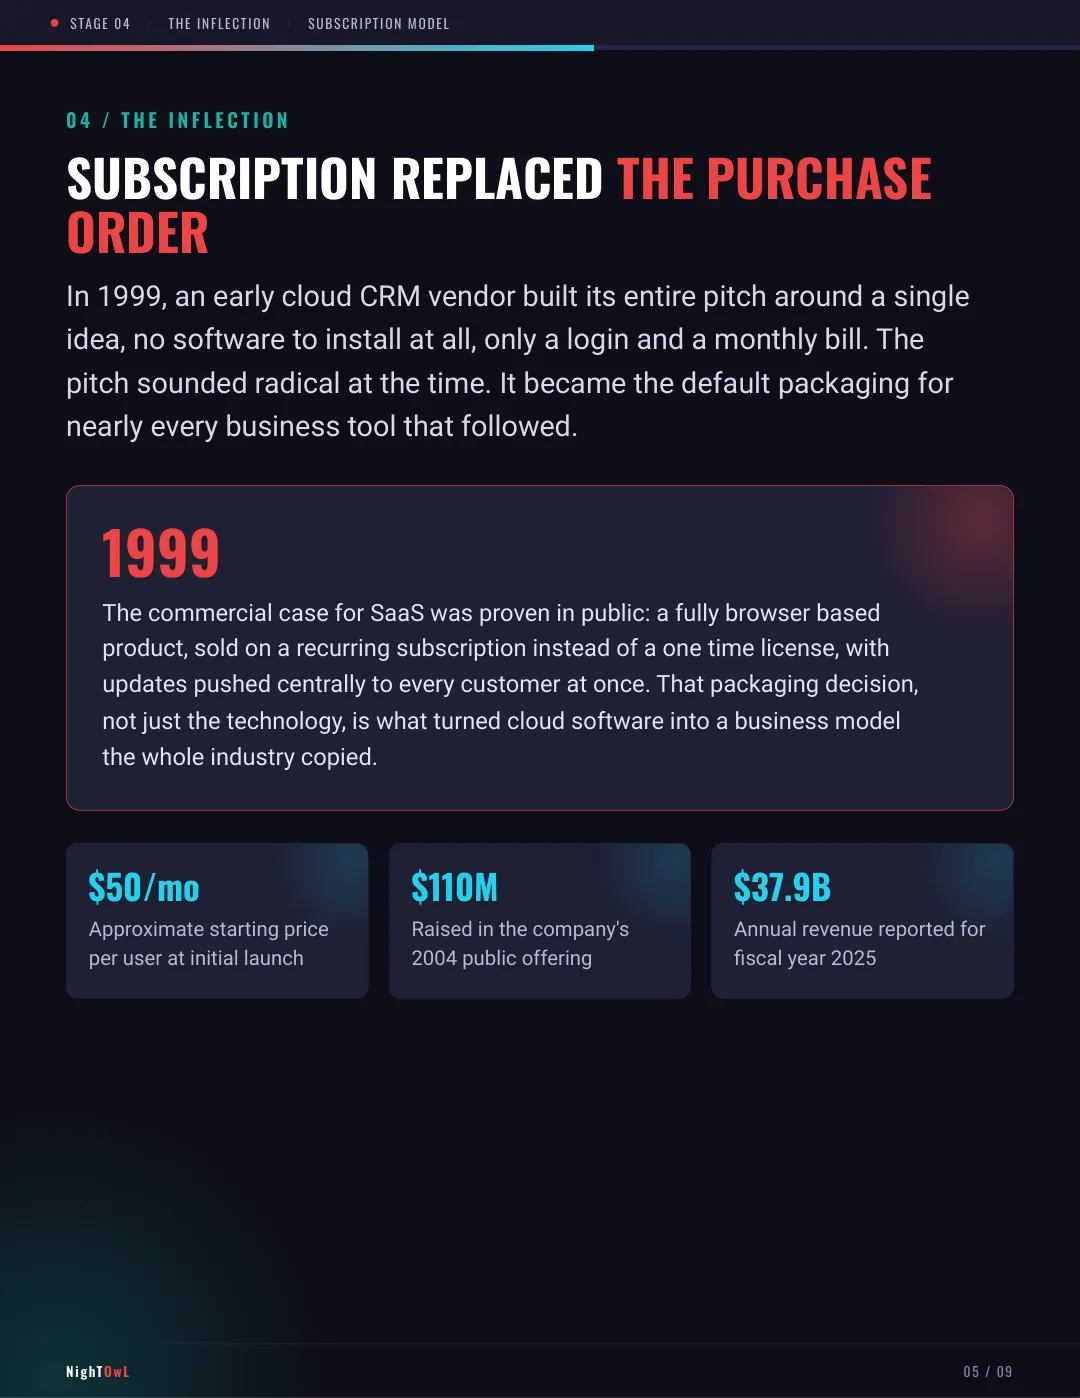
0 4 / T H E I N F L E C T I O N
SUBSCRIPTION REPLACED THE PURCHASE
ORDER
In 1999, an early cloud CRM vendor built its entire pitch around a single
idea, no software to install at all, only a login and a monthly bill. The
pitch sounded radical at the time. It became the default packaging for
nearly every business tool that followed.
1999
The commercial case for SaaS was proven in public: a fully browser based
product, sold on a recurring subscription instead of a one time license, with
updates pushed centrally to every customer at once. That packaging decision,
not just the technology, is what turned cloud software into a business model
the whole industry copied.
$50/mo
Approximate starting price
per user at initial launch
$110M
Raised in the company's
2004 public offering
$37.9B
Annual revenue reported for
fiscal year 2025
NighTOwL
05 / 09
Slide 6
STAGE 05
•
SIDE BY SIDE
•
INSTALLED VS SAAS
0 5 / T H E C O M PA R I S O N
TWO MODELS, ONE WINNER
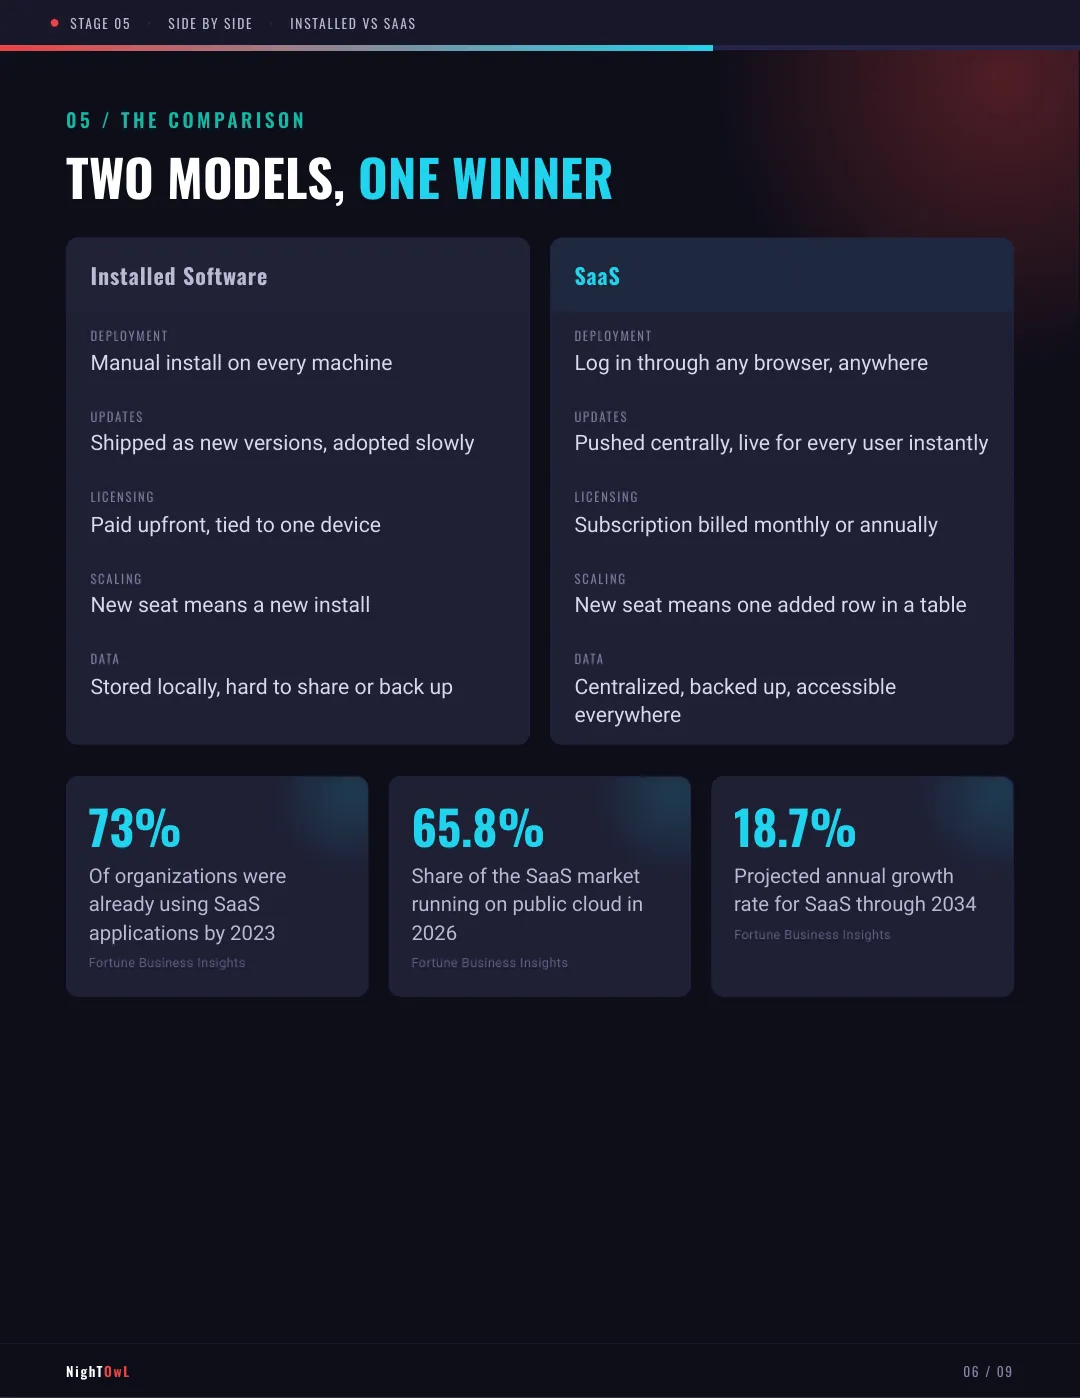
Installed Software
DEPLOYMENT
Manual install on every machine
UPDATES
Shipped as new versions, adopted slowly
LICENSING
Paid upfront, tied to one device
SCALING
New seat means a new install
DATA
Stored locally, hard to share or back up
SaaS
DEPLOYMENT
Log in through any browser, anywhere
UPDATES
Pushed centrally, live for every user instantly
LICENSING
Subscription billed monthly or annually
SCALING
New seat means one added row in a table
DATA
Centralized, backed up, accessible
everywhere
73%
Of organizations were
already using SaaS
applications by 2023
Fortune Business Insights
65.8%
Share of the SaaS market
running on public cloud in
2026
Fortune Business Insights
18.7%
Projected annual growth
rate for SaaS through 2034
Fortune Business Insights
NighTOwL
06 / 09
Slide 7
STAGE 06
•
THE STACK TODAY
•
HOW SAAS RUNS NOW
0 6 / T H E S TA C K T O D AY
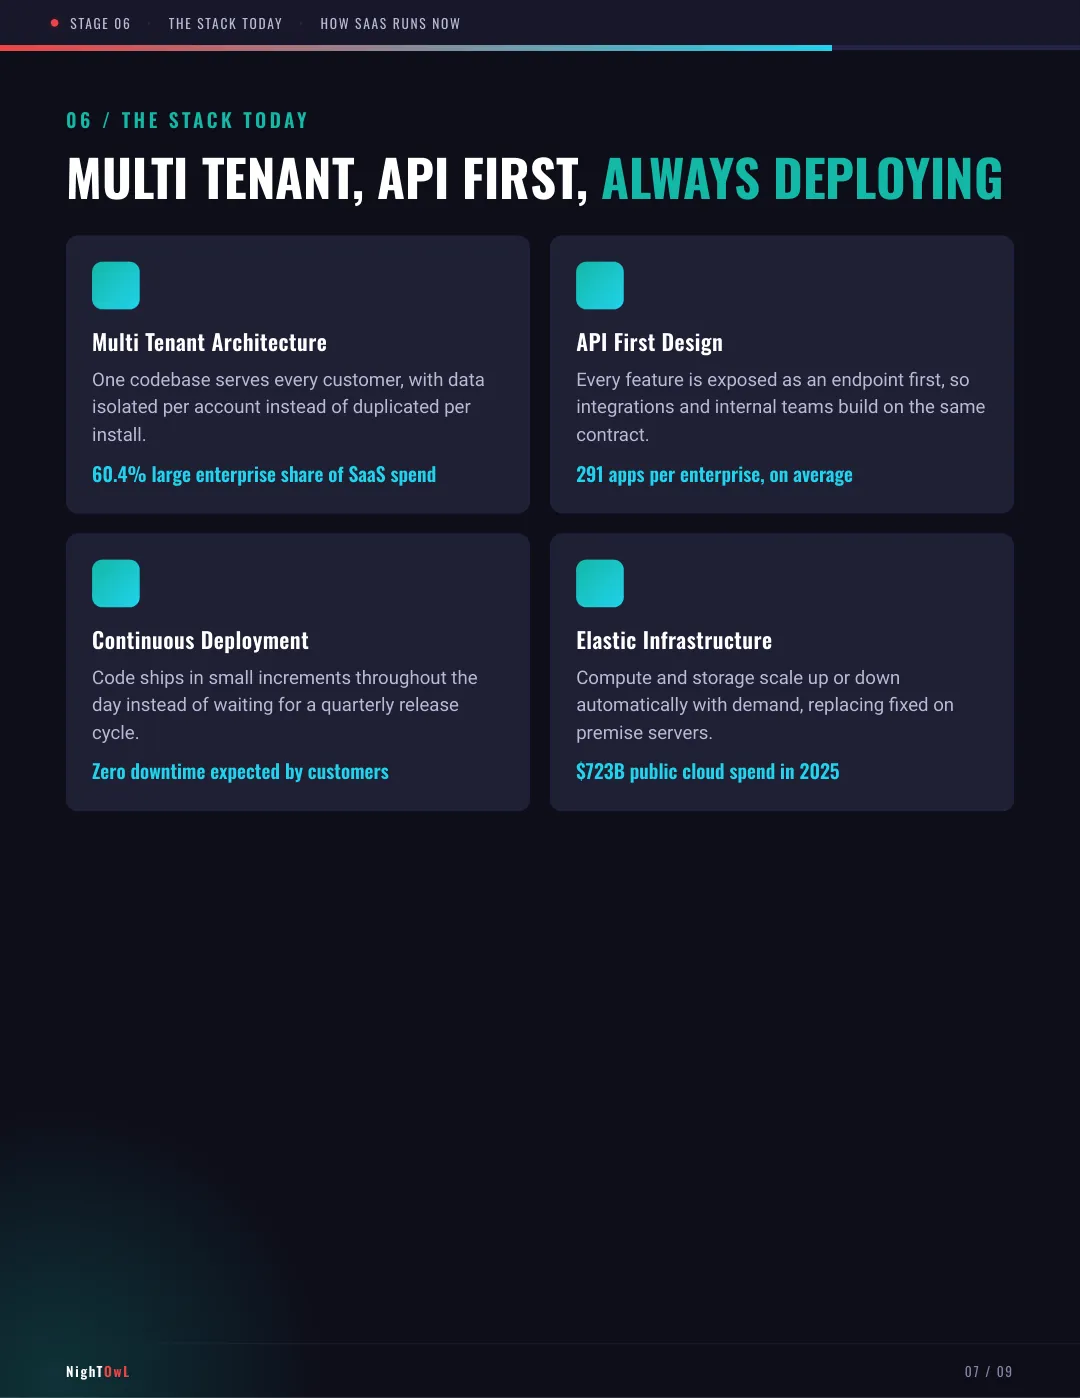
MULTI TENANT, API FIRST, ALWAYS DEPLOYING
Multi Tenant Architecture
One codebase serves every customer, with data
isolated per account instead of duplicated per
install.
60.4% large enterprise share of SaaS spend
API First Design
Every feature is exposed as an endpoint first, so
integrations and internal teams build on the same
contract.
291 apps per enterprise, on average
Continuous Deployment
Code ships in small increments throughout the
day instead of waiting for a quarterly release
cycle.
Zero downtime expected by customers
Elastic Infrastructure
Compute and storage scale up or down
automatically with demand, replacing fixed on
premise servers.
$723B public cloud spend in 2025
NighTOwL
07 / 09
Slide 8
STAGE 07
•
THE SCALE TODAY
•
MARKET SIGNALS
0 7 / T H E S C A L E T O D AY
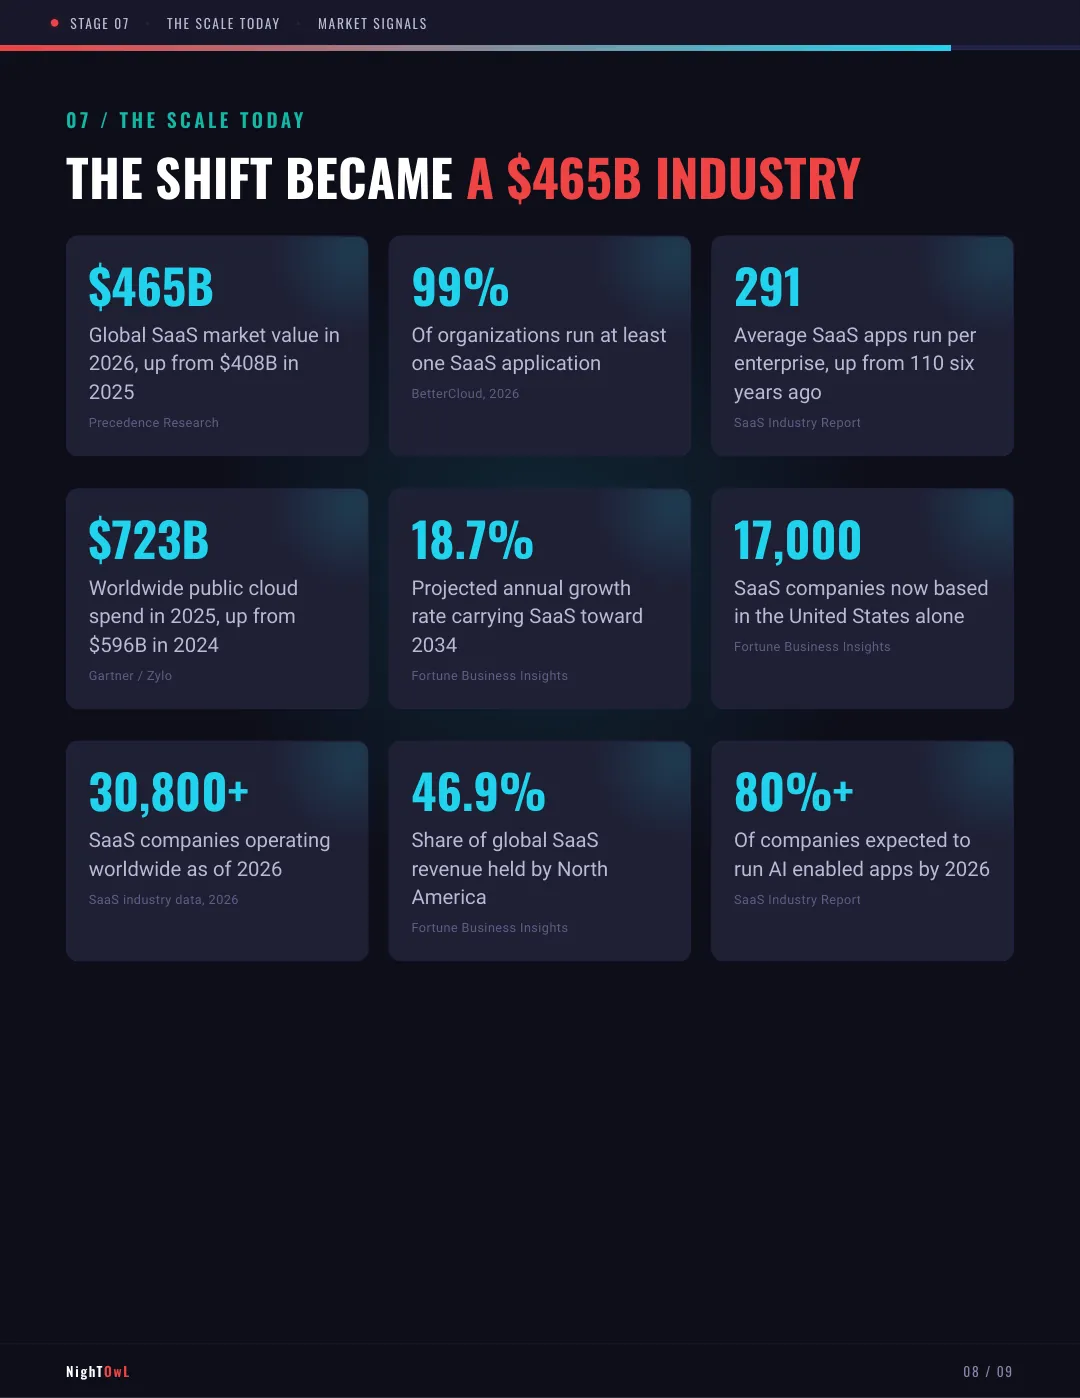
THE SHIFT BECAME A $465B INDUSTRY
$465B
Global SaaS market value in
2026, up from $408B in
2025
Precedence Research
99%
Of organizations run at least
one SaaS application
BetterCloud, 2026
291
Average SaaS apps run per
enterprise, up from 110 six
years ago
SaaS Industry Report
$723B
Worldwide public cloud
spend in 2025, up from
$596B in 2024
Gartner / Zylo
18.7%
Projected annual growth
rate carrying SaaS toward
2034
Fortune Business Insights
17,000
SaaS companies now based
in the United States alone
Fortune Business Insights
30,800+
SaaS companies operating
worldwide as of 2026
SaaS industry data, 2026
46.9%
Share of global SaaS
revenue held by North
America
Fortune Business Insights
80%+
Of companies expected to
run AI enabled apps by 2026
SaaS Industry Report
NighTOwL
08 / 09
Slide 9
STAGE 08
•
THE TAKEAWAY
•
ACCESS OVER OWNERSHIP
0 8 / T H E TA K E A W AY
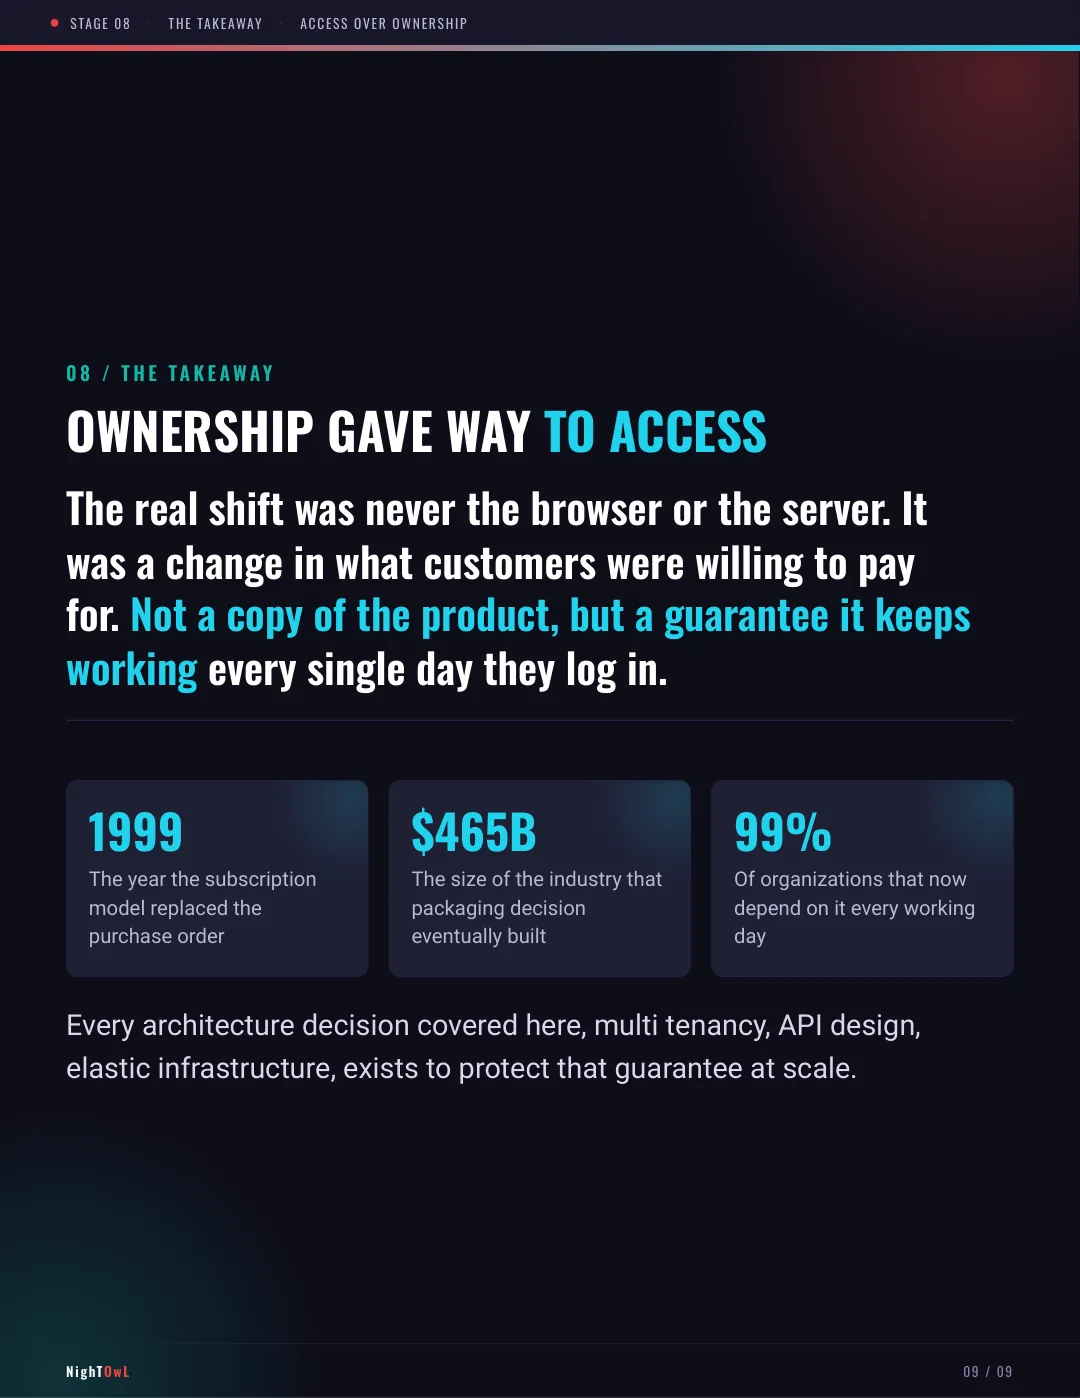
OWNERSHIP GAVE WAY TO ACCESS
The real shift was never the browser or the server. It
was a change in what customers were willing to pay
for. Not a copy of the product, but a guarantee it keeps
working every single day they log in.
Every architecture decision covered here, multi tenancy, API design,
elastic infrastructure, exists to protect that guarantee at scale.
1999
The year the subscription
model replaced the
purchase order
$465B
The size of the industry that
packaging decision
eventually built
99%
Of organizations that now
depend on it every working
day
NighTOwL
09 / 09